Chart Of The Month – Visit Here Every Months First Week
हर महीने का Chart Of The Month का अनालीसिस देखने के लिए इस पोस्ट को हर महीने के पहले सप्ताह मे सोमवार को जरूर भेट दे।
I’m just sharing my personal view as a trader and Whatever I discuss about share market, Chart Of The Week, Chart Of The Month is only for educational purpose. So please consult your financial adviser before taking any decision. Because trading in equity market is very risky and you can loose your part or all money. kickstartonline.in and it’s admin and any one associated with us will not responsible for any losses and profit incurred by following this blog post and videos.
👇 हा रु. 4720/- चा कोर्स अगदी १०० % मोफत खास Kick Start Online चा वाचकांसाठी 👇 हा Coupon Code वापरा 👇
AFF100

Chart Of The Month – Analysis View More Than Six Months Date 01/08/21
- Stock
- Date Of Analysis
- For Time Period
- Expected Target
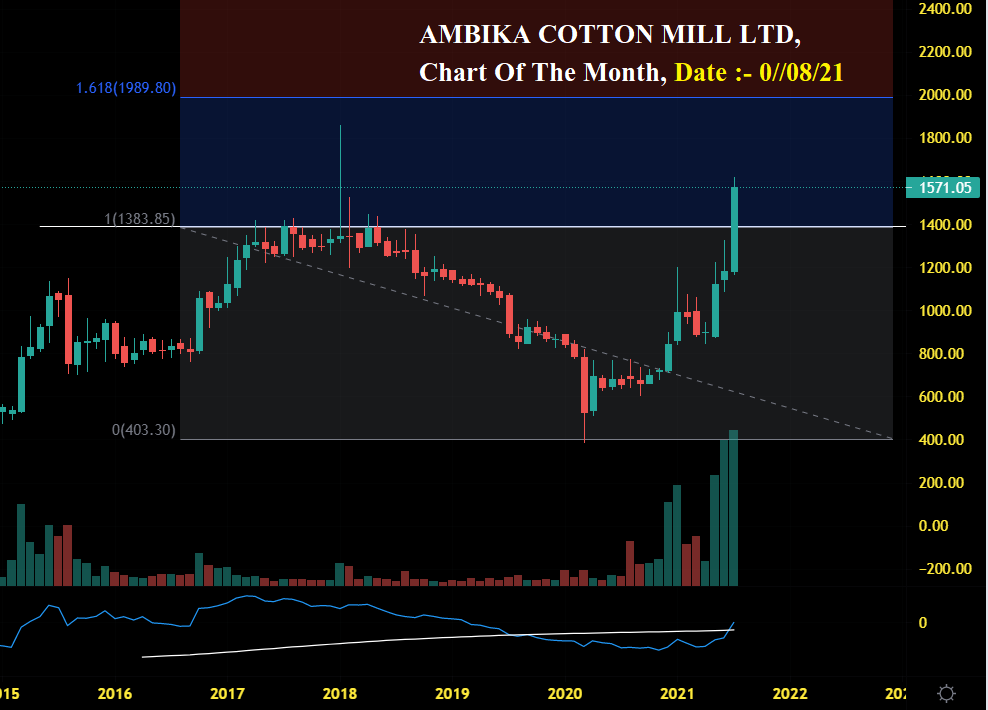
- AMBIKA COTTON MILL LTD
- 01/08/21
- 6 & Above (LT)
- 1989 As Per Fibonacci
On Monthly Chart AMBIKA COTTON MILL LTD Break 1400. with huge volume. Also On Special Indicator It’s now outperforming nifty. Also Textile Sector is looking good in coming days. But If it close below 1390-1400 it will be considered as weak stock.
Special Intraday Indicators का नाम और Settings जानने के लिए नीचे दिए ३ नो Social Media प्लेटफॉर्म हमे फॉलो & Message करे.
👉Follow On Instagram @powerofcharts
👉 Join TelegramGroup
👉Subscribe YouTube
और तीनों जगह पर ये Message / Comment कीजिये 👉 ( “I Want Indicator Name & Setting”) OR 👉 (“मुझे इन्डिकेटर के नाम और सेटिंगस चाहिए”)
या फिर
हमारे साथ शेअर ट्रैडिंग खाता खोले, आप अगर हमारे साथ शेअर ट्रैडिंग अकाउंट ओपन करना चाहते है तो 👉 खाता खोलने के लिए यहा क्लिक करे और स्पेशल Premium Strategies सबसे पहले प्राप्त करे।
Chart Of The Month – Analysis View More Than Six Months Date 04/07/21
- Stock
- Date Of Analysis
- For Time Period
- Stop Loss
- Expected Target – 1
- Expected Target – 2
- Expected Target – 3
- Target Archived Date
- Stop Loss Triggered Date
- JSW Energy
- 04/07/21
- 6 & Above (LT)
- 127 – ATR
- T1 – 184 As Per Fibonacci
- T2 – 277 As Per Fibonacci
- T2 – 370 As Per Fibonacci
- Open
- Open
In Monthly Chart Stock Breaks Major Resistance Of 127 After Sep 2010, With Huge Volume. And Double Bottom W Pattern Breakout. So I Include This In Our Chart Of The Month. The Analysis For 6 Month And Above
Chart Of The Month – Analysis View More Than Six Months Date 28-06-21
- Stock
- Date Of Analysis
- For Time Period
- Stop Loss
- Expected Target – 1
- Expected Target – 2
- Expected Target – 3
- Target Archived Date
- Stop Loss Triggered Date
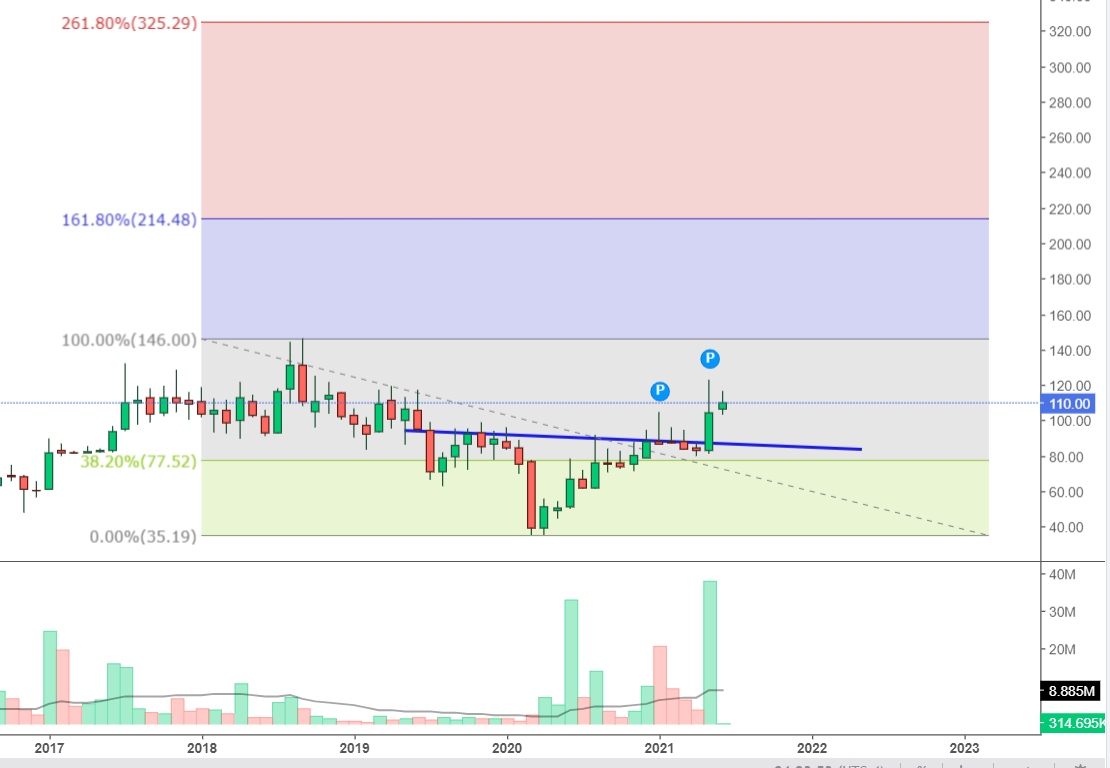
- JTEKT INDIA LIMITED
- 28/06/21
- 6 & Above (LT)
- 89 – ATR Value
- T1 – 141 -146
- T2 – 214 As Per Fibonacci
- T3 – 325 As Per Fibonacci
- Open
- Open
In Monthly Chart Stock Breaks Major Resistance Of 89 -90 After July 2019, With Huge Volume. And Head & Shoulder Pattern is Also Made in it. So I Include This In Our Chart Of The Month. The Analysis For 6 Month And Above
Disclaimer:
It’s Not An Investment Advice, Before Investing Must Consults With Your Financial Adviser. This Website And It’s Founder Will Not Responsible For Any Of Your Losses.
This Content Is Purely 100% Only For Educational Purpose
To Learn More:
Must Visit & Subscribe To Our YouTube Channel, There We Also Share, Different Trading Strategies In Hindi. Just Click The Button Below To Watch Our Popular Intraday Strategy Video.
And Also Don’t Forget To Subscribe Our Channel To Get Notification On Time. Because The Game Of Share Market Is Depends On Timing, If You Enter & Exit At Correct Time. You Can Get Good Results From Stock Market Hindi.
Click On Button Below To Watch Popular Unique Intraday Strategy In Hindi & Marathi


